Google Analytics has a lot of great reporting capabilities and features. Too many people don’t use them because they may not be obvious, or may take some time to set up, or their inputs may not be properly set up. Whatever the reason, it is worth overcoming it to benefit from these Google Analytics capabilities.
Google Universal Reporting overview
These capabilities are part of Google Universal. Yes, Google wants everyone to migrate to Google G4, and you should. But the reality is that Universal Analytics will be around for a while. The amount of time you spend setting up proper GA reporting will be well worth it for the next year or two or more before your G4 migration.
GA Universal has several areas for reporting. All of them have their own value, and which ones you use will depend on what questions you want to answer. And this is the key point for any reporting setup.
The first step is to gather the questions you need to answer, how often you need the answers, and what you will do with the information. Too often, we see people set up elaborate reporting schemas, but don’t really have an idea of what the action items might be.
To get to the questions it helps to start with something as basic as your responsibilities.
- What actions do you take and how often?
- To decide on those actions, what information do you need, questions answers?
- Finally, how will you know if your decisions and actions actually made an impact?
The type of reporting and frequency will be based on the answers to these questions.
Daily reporting is often a comfort rather than a practical use of your time or resources. Do you take action every day based on yesterday’s metrics? If so, then daily reporting makes sense. If not, then daily reporting becomes a distraction, or worse, encourages you to ignore information because it comes in too often without changing.
Design your reporting around the three questions above, and you’ll find your time is much more productive.
Though we really like the reports shown below, the standard sets of reporting capabilities are very useful. You should be sure to explore these to understand if they serve your needs before investing time and resources in customizing reports and dashboards. Don’t over-engineer your reporting.
Our Favorite Types of Google Analytics Reports & Features
1. Google Analytics Alerts
One frustration people have is learning about a problem well after it started. These situations often lead to prolonged poor user experience, lost revenue, or large gaps in information. If you are charged with maintaining a website, or your goals are impacted by various parts of site performance, then Google Analytics Alerts can help you stay on top of things without having to constantly log into GA or your site to check.

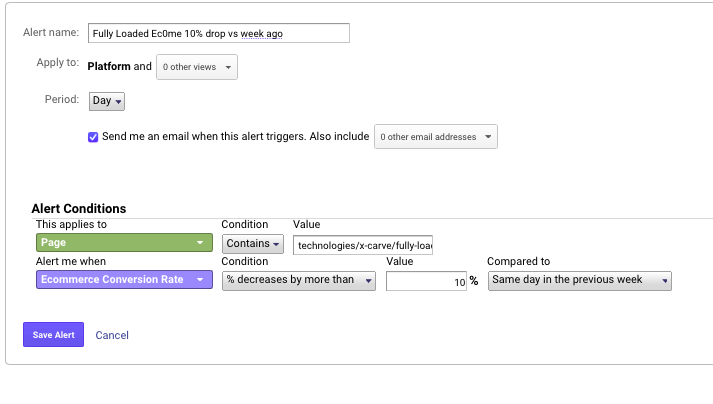
You set up your Custom Alerts in the Admin area for a given View.
Take a look at the options that are relevant to your responsibilities. If it’s eCom conversion rates, you can create an alert for a drop vs a prior period or below a certain level. Basically, anything that you can measure in GA can be the basis for an alert.
The alerts can be set to be emailed to yourself or others.
A few things to keep in mind.
- The alerts are intended to be triggered based on performance. So, they work over a daily period or longer.
- Be sure of your threshold. Getting alerted every morning because you set the conversion rate threshold too low will lead to you ignoring the alerts. If the threshold is truly accurately set, but likely to trigger alerts, you need to address the core issue causing the low conversion rate before setting up the alert.
- GA Alerts are not intended to notify you of catastrophic events. If your site crashes today, you’ll not know until tomorrow. If page load speed drop significantly, again, you’ll not know until tomorrow. There are other tools available to monitor major events like these.
Google Analytics Alerts are a great tool if you follow the “management by exception” philosophy. As long as things are going well, you don’t need to constantly monitor reports. But, when something falls off (is an exception), you want to know and manage it.
2. Google Analytics Dashboards
A Dashboard is a great type of report that concisely shows important information and lets you keep an eye on trends, general performance, and any exceptions. The key is that the elements of the dashboard remain consistent so you can tell, almost at a glance, if something seems off.
The purpose of the dashboard is to provide a higher-level view of performance and indicates where and when you may need to delve deeper. This is often made analogous to the instruments in an airplane cockpit. They’re designed to be quick and easy to read, so we know if there is an approaching issue.
In addition to the traditional approach of using an analytics dashboard, we also like to use them when we launch a new initiative. Set up properly, with the right filters, and you can closely monitor virtually any segment of your website traffic against target metrics. This makes it easier to see if the initiative is on target or you need to adjust your plan.
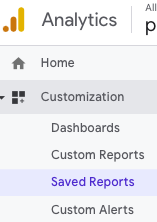
Setting up a dashboard in GA is pretty straightforward. On the left-hand panel under Customization, you click on Dashboards. Then, click the red “Create” button.
At this point, you will have three options:
- Blank Canvas. I recommend holding off on this option until you are familiar with the widgets and filters of the dashboard.
- Starter Dashboard. This is a good, basic dashboard about general user stats for the site. It won’t show you much by way of nuance, but it is a good overview of the site’s performance.
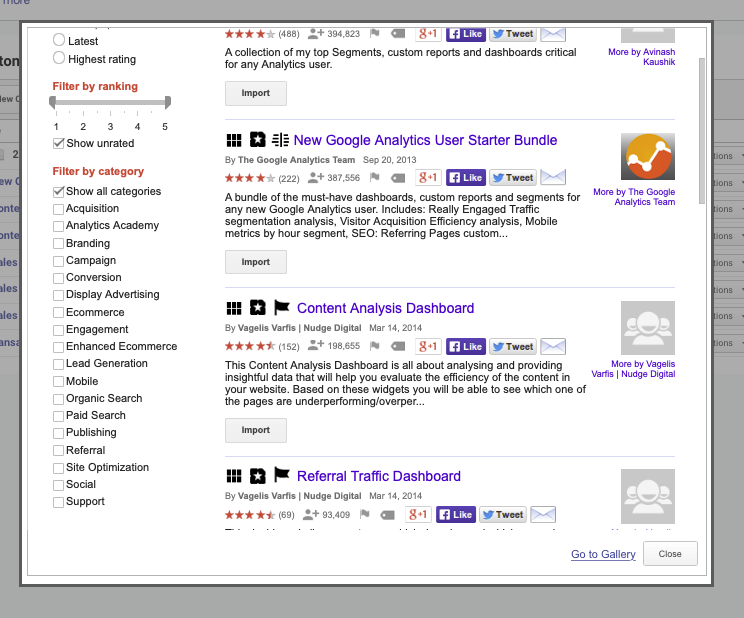
- Import From Gallery. The GA Dashboard gallery is pretty well populated and a great way to explore different layouts and ways to view your GA data. One caveat is that some of the dashboards in the gallery might make assumptions about how your GA is set up and your data may not fit their dimensions, metrics, and filters.
Once you are in a dashboard, you will see a few options at the top. The first is the “+Add Widget”. Dashboards are comprised of widgets displaying graphs, tables, counters, etc.
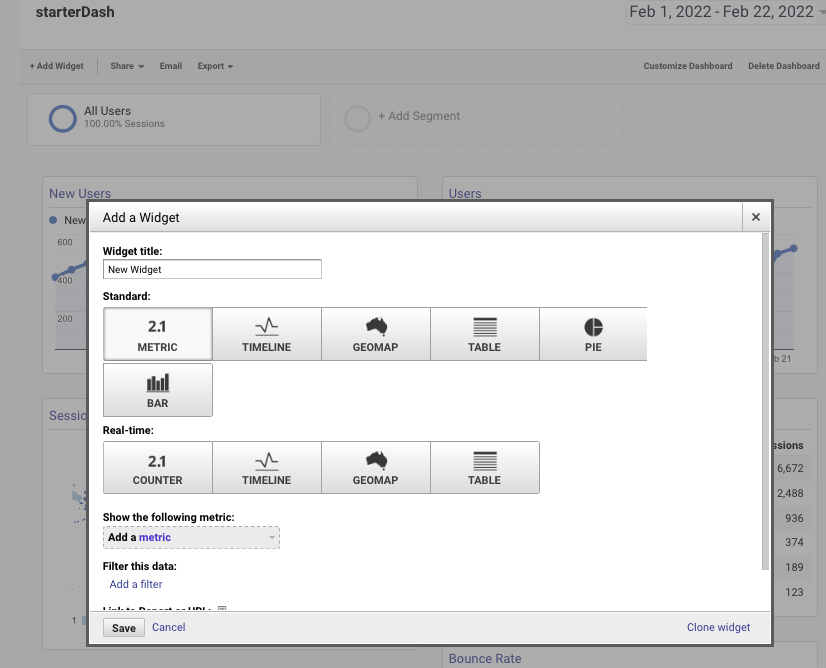
There are a lot of configurations you can create. But, one of the most useful elements is the “Filter.” This handy tool lets you isolate the site traffic to that which is important to you.
Most of us look at segments of the traffic, such as paid search or certain content/pages, among other dimensions.

Explore the dimensions and you will likely find that you can narrow the scope of the dashboard data to what is most relevant to your reporting needs.
If you are starting out, focus on playing with the “Starter Dashboard,” editing the widgets to see what happens.
Then do the same with the gallery dashboards. After a while, you’ll be able to add the widgets and filters that show you the information in the format you need.
3. Google Analytics Custom Reports
The custom reports, also under Customization, allow for the same data and filter access as the Dashboard. But, the reports tend to be narrow and deep, whereas dashboards tend to be wide and shallow.
Galleries are also available in the Custom Report area. These reports tend to be good for metrics shown over many elements of a dimension. Think product sales, conversion rates by date by channel. These are data tables built to show metrics and dimensions in a way that the default to Google’s UI reporting doesn’t.
There are three basic ways to set up reports.
Build the report

start by selecting the metrics, then the dimensions. You have the option of creating flat tables or building in a drill-down table.
Additionally, you can add multiple tabs. This can get tricky because there is a temptation to add tabs upon tabs, leading to data creep. Falling into this trap causes reports that become unuseful, they lose their focus.
When creating these reports, one of the most important tools is the filter. Generally, without filters, the data in reports created here are very similar to the standard reports in the GA UI.
Import from Gallery
Like Dashboard, there is a robust custom reports gallery. The gallery has some great filtering capabilities that will let you narrow the scope to the most relevant types of reports.
When you look through the Gallery, be careful to select reports and not dashboards. These are usually identified in the title.
Finally, before you build a report from scratch, take a look at the next way to create custom reports.
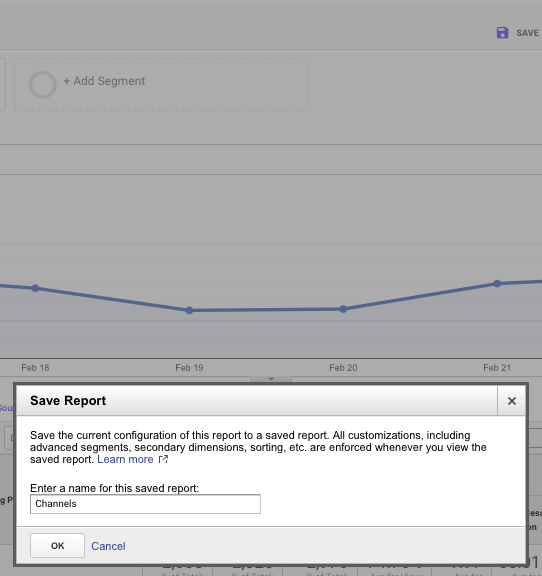
4. Saved Reports
I am combining “Saved Reports” with “Custom Reports” because what you save from the regular Google Analytics UI has been customized.
If you find yourself going into the standard reports in GA, adding the same secondary dimension, and the same filters to review data on a regular basis, this should be created as a saved custom report. And Google makes it easy with the “Save” button at the top.
The good thing about the Custom reports and the Saved reports is that they have the same date range selection as all GA reports. Also, if you want to make tweaks, or try out different dimensions, you can duplicate the report. This lets you keep the current report intact while checking out some options.
5. Goal Funnels
Perhaps one of the most useful reports for optimizing the users’ path to your target goals is the Conversion Goal Funnel visualization. This is something we like to use with the purchase funnel but can be used with any goal that requires the user to take discreet steps.
To start, you need to set up a goal in the View’s Goals section. Creating a destination goal, with steps along the way.
Generally, the steps are discreet pages that the user clicks through on the way to the goal destination. This may be a thank you page, transaction confirmation, or some other content consumption.
There are several reasons the funnel visualization is useful. At a high level, it tells the conversion rate from when someone starts the process to when they complete it.

But, more telling is that at each stage, you can see the funnel drop off and where the users went, either as an exit or to which pages on the site they went.
A closer review of this information can provide insight as to why people are dropping off. This can be used to decide where you might run A/B testing, or change content to ease the flow from one step to the next.
Helpful Google Analytics Features
Generating reports is great, but providing features to share, annotate and append the data are key strengths in Google Analytics. The rest of our favorite features in GA incorporate these capabilities and we’ve found it to be very useful.
6. Exporting GA Reports
A nice aspect of Google Analytics reporting is the ability to share the report via email, PDF, or spreadsheet. You can export the various reports for downloading or send them to a Google Docs Spreadsheet. You can also set the reports to be emailed on a one-time basis or as a scheduled report.
7. Notation in GAs UI
Often, when we see changes or odd blips in the GA data, we ask what happened that may have caused. A neat feature of Google Analytics is the ability to make date-based notations that appear wherever the graph of data is seen. Make notations as things happen, even if you don’t initially see a data impact. This will help when looking back to explain data trends.

8. Data Importing
A great feature of Google Analytics is the direct connection to Google Ads, being able to see the cost, clicks, and impressions by various dimensions. This feature is extended to other channels via the data import feature in GA.
There are several types of Data Import. We most often use Cost data. A key consideration is that your UTM parameters’ values match the medium, campaign, content, and other dimensions that are being passed through with the channel data that you upload.
If you are responsible for media performance, this tool makes it easier to create a single repository of your media metrics and performance KPIs. You will find this feature in the properties admin section.
9. Audience Definitions – Audiences
Creating audiences allows you to segment your visitors into distinct profiles that can be used in Google Ads, or in segmenting your reporting. This is great for remarketing, optimizing the user experience, or just understanding how some segments behave versus other segments.
As you explore Google Analytics, you will no doubt find features that you favor over others. The fact is, there is a lot that can be done in GA. These 9 features just barely scratch the surface.
From integrating other Google Tools, to creating content segments, or custom dimensions, you can design just about any kind of reporting you need in order to make decisions. Just be sure you plan what you need ahead of time.
Leave a Reply